Summary of our trip in numbers …
- 458days from Provincetown to Buenos Aires
- most of the time we were standing (208 days), bicycling (169), riding on a boat (49), hitchhiking (29), riding car (18), bus (17) a walking (13)
- we’ve visited 17 countries (USA, Bahamas, Haiti, Cuba, Mexiko, Guatemala, El Salvador, Honduras, Nicaragua, Costa Rica, Panama, Colombia, Ecuador, Peru, Bolivia, Chile, Argentina)
- the most days we stayed in USA – 129 days, Chile – 63, Ecuador – 45, Guatemala – 34, Peru – 33 … 2 tiems we needed viza (USA, Cuba)
- except USA, Bahamas(EN) and Haiti (FR+creole) everywhere they speak Spanish
- on bicycles we made 8850km together (900 on Cuba)
- other trasnportatio (boat, bus, hitchiking): 16700km (catamaran 4000km)
- mostly we slept on boat (114 nights), at somebody’s place (108), in the tent (82 + 21x in camps), hotels and hostels (94), outside at somebody’s (24), in a car (7) and bus (6)
- most of the free nights were at Casa de Ciclistas 40x, warmshower hosts 16x, firemen station 14x, couchsurfing 6x, caravan 3x, army 2x, navy 2x
- we met 126 cyclists (most of them on Carretera austral, nice example is at Klaus webpage)
- we had more than 30 flat tires (most of them in Central America)
- we changed 8 tires and 5 chains
- we uploaded 3500 photos to picasaweb, and made 7 hours of video
- till now we wrote 86 blog posts
- totla expenses are difficult to count because we were working the first 4 months but just during the time of travelling (without fly tickets) we spent approx 16300eur together (17.30€/day/person – including all transports, insurance, accomodation, food, entrance fees, bicycles, …)
- the highest point we were standing at was the first summit of Chimborazo – 6228m elevation and the highest bicycling was around 5000m in Bolivia
- 11 children were born among our friends during our travelling :)
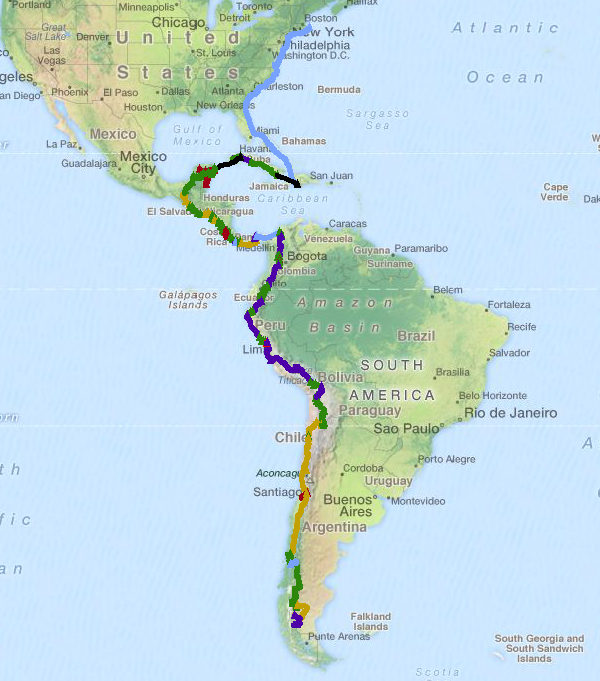
Map of the trip (blue – boat, green – bike, black – airplane, red – car, yellow – hitchhike, violet – bus) – klick for enlarge:


